Further Test of PS-Pack cooling system with 4m Al pipe
T.Takashita(3)
Department of Physics , Shinshu University, Japan
________________________________________________________
1. Test set up and measurement system
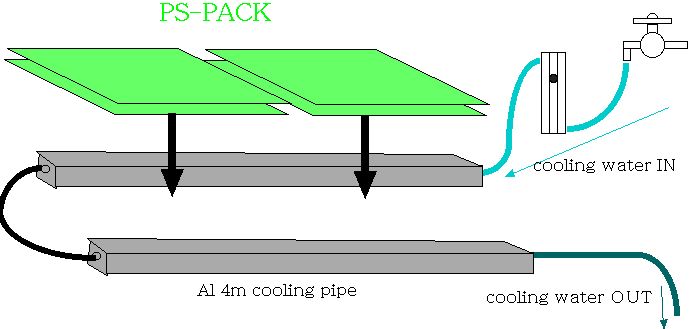
The test set up is shown in Figure 1 shcematically and in
Figure 2 as a picture.
Figure 2 : test set up picture
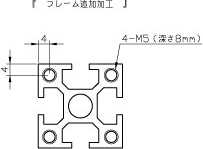
At this test two aluminum cooling pipes of 4m long each is suppied, which is supposed to be used as the legs of the PS-PACKs. The cross section is shown in Fig.3, where the coolrant (water) goes though a hole of 8.5mm-phi at the center.
Figure 3 : cross section of an aluminum cooling pipe
The Figure 4 shows the two cooling pipes on the floor, just before this test.
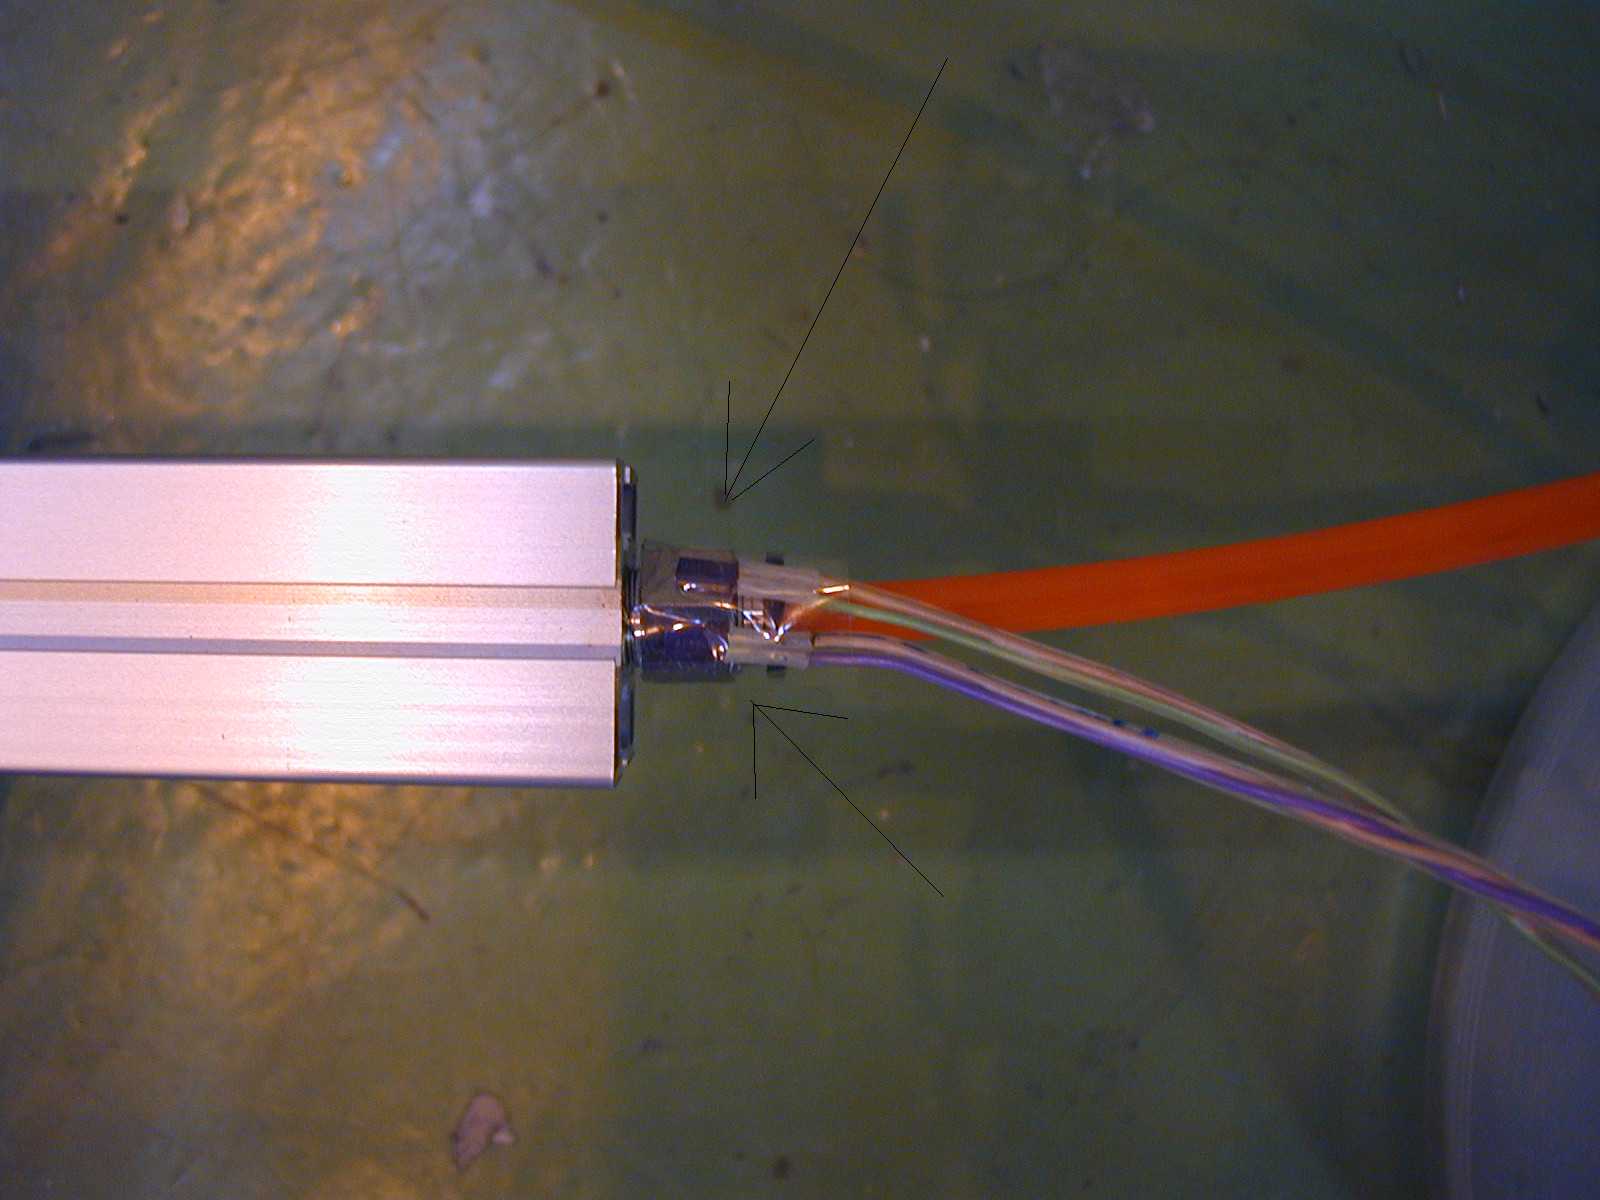
Two temereature probes of AD590 are attached at the inlet and outlet of the cooling pipe. It is shown in Figure 4. They are calibrated at the same place at the same temerature. We discuss here the temperature difference betwenn those two temeperature probes as dTemp.
Figure 4 : temperature probes on the cooling pipes during the calibration
Those temperatuer probes are monitored by a data recorder every 5 sec.
The test PS-PACKs are brought from the previous cooling test. The total registance in these PS-PACKs are 6.0 Ohm which generate heat during the test.
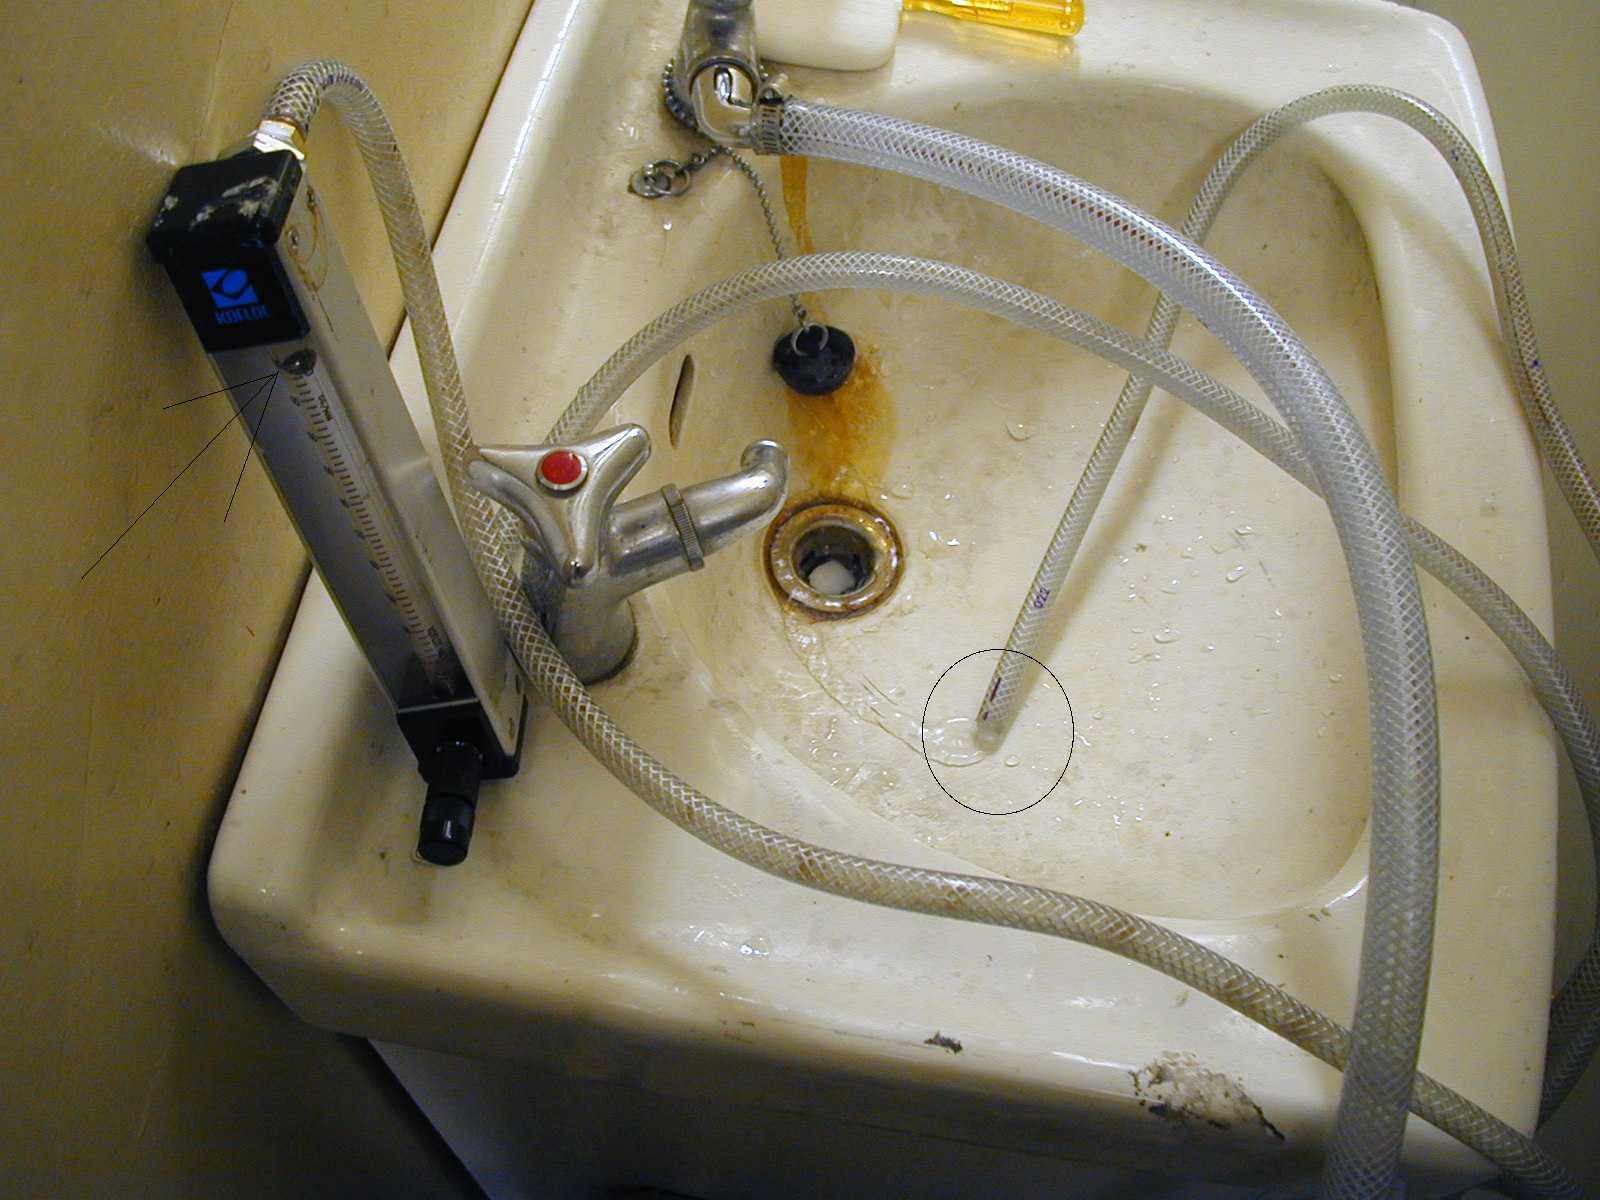
The cooling water flow rate was fixed to be 500ml/min.
Figure 5 : water flow rate of 500ml/min
2. Test results
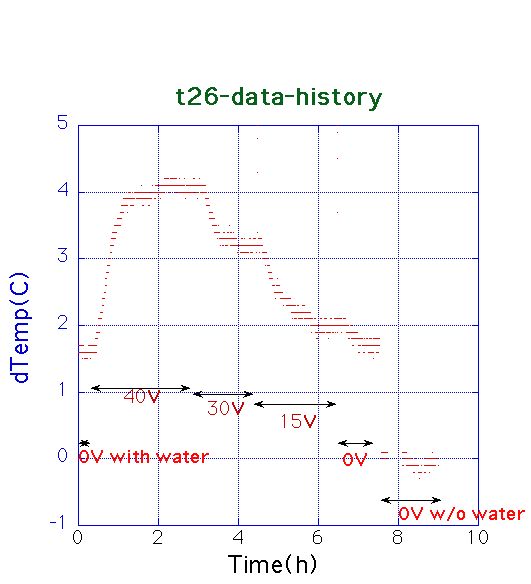
A history of the data recorded is shown in Figure 5. The horizontal axis is time in hour and the vertical axis is temperature difference in degree. At the fist point we had two calibrated temereature probes so that the data indecated at zero dTemp at Time-zero. And Finaly at the last point of this whole test, the temperature came back to the same point as expected.
Figure 6: dTemp history of the cooling test
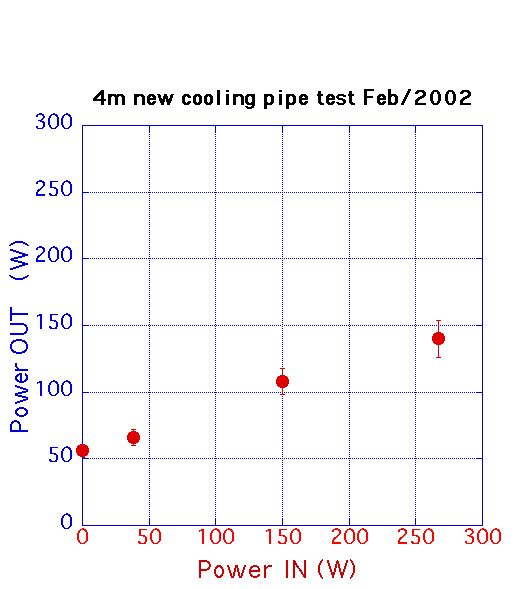
From this history, we can extract the cooling efficincey as shown in Figure 6, where the heat generated in the PS-PACKs is indicated at the horizontal axis and the heat remove to the cooling water is indecated at the vertical axis. As shown in Figure 6, the 4m cooling pipe and the 2m PS-PACK can take 56 W without any heat generated. As the expected power generated at 4m PS-PACK is expected 150W, the efficiency would be 108/150=72%.